Kansas Soil Moisture Update – September 23, 2026
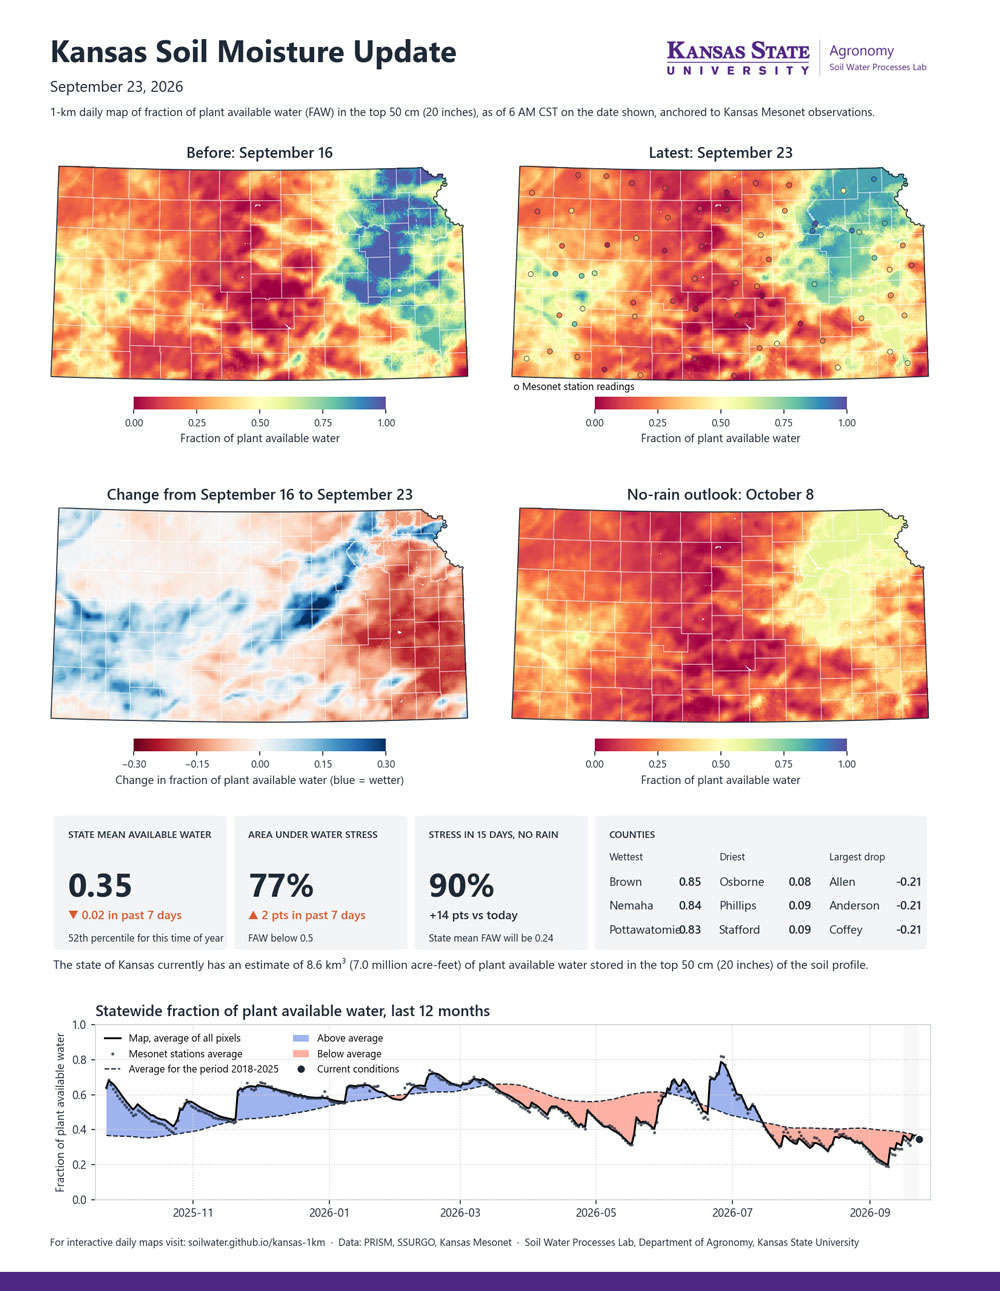
Soil moisture changed little statewide during September 16–23, with gains in some areas and losses in others. The statewide average fraction of plant available water (FAW) in the top 20 inches of soil fell slightly from 0.37 to 0.35, and the area below the water-stress threshold increased to 77%. Rainfall brought gains along a narrow band from central to northeast Kansas and in parts of western Kansas. Southeast Kansas dried out, and Allen, Anderson, and Coffey counties had the largest drops (a 0.21 decrease in FAW). Northeast Kansas remains the wettest part of the state, with Brown, Nemaha, and Pottawatomie counties averaging an FAW above 0.80. Osborne, Phillips, and Stafford counties reported the lowest county averages (FAW of 0.08–0.09). If no additional rain falls, the report projects that 90% of the state will be below the water-stress threshold by October 8.
Understanding Plant Available Water and FAW
Plant available water is the portion of soil moisture that plants can use. It is the water held between the wilting point and field capacity. The maps show the fraction of available water (FAW) in the top 20 inches of soil on a scale from 0 to 1, where 0 means no plant available water remains and 1 means the soil holds its full supply after excess water has drained away. A value of 0.5 means about half the plant available water remains, a level at which many crops may begin to experience water stress. Because each mapped location is scaled to its own wilting point and field capacity, the same color represents the same fraction of available water statewide, allowing comparisons across different soil textures.
About the Kansas Soil Moisture Update
The Kansas Soil Moisture Update will provide regular snapshots of soil water conditions across the state under rainfed conditions, particularly when soil moisture can influence crop and field management decisions. The maps are developed by the Soil Water Processes Laboratory in K-State’s Department of Agronomy under the direction of Dr. Andres Patrignani and use Kansas Mesonet observations. Interactive daily maps are also available from the Soil Water Processes Laboratory at soilwater.github.io/Kansas-1km
Andres Patrignani, Associate Professor in Soil Water Processes
andrespatrignani@ksu.edu