Summer 2026 in Kansas – The Meteorological Season in Review
Meteorological summer 2026 began on June 1 and came to a close on August 31. In this article, we summarize the weather conditions experienced across Kansas over the past three months.
Temperature
A total of 63% of the days, 58 out of 92, featured above normal temperatures, based on statewide averages of daily data observed by the more than 90 automated stations of the Kansas Mesonet. Each of the three summer months averaged above normal, per data released by the National Centers for Environmental Information (NCEI) in early September. June was 0.8° above, July 1.8° above, and August 3.9° above normal. When the three months are combined and ranked against previous June-July-August periods, meteorological summer 2026’s average temperature was 78.9°, ranking as the 14th-warmest among 132 years of climate records dating back to 1895. It was also the warmest summer since 2012. The record for the warmest summer was back in the Dust Bowl year of 1934, when the average temperature was 83.2°. Three of Kansas’ nine climate divisions finished in the top 10 on their respective lists of warmest summers on record. Southwest Kansas had the highest ranking at the 6th warmest. West central finished at 8th warmest, and south central Kansas’ summer ranked as 10th warmest. Northeast Kansas’ ranking was the lowest at 40th warmest.
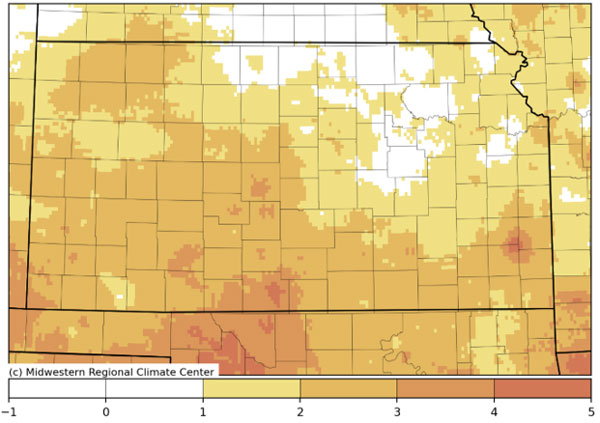
Figure 1. Average summer 2026 departure from normal temperature. Map by the Midwestern Regional Climate Center.
High temperatures averaged 90 degrees or warmer on 56 days during summer: 9 days in June, 23 in July, and 24 in August. Eleven days had an average high of at least 100 degrees. The first of these days did not occur until July 20. Of the ten additional triple-digit days, three came in July followed by seven more in August. The warmest day of summer, based on average daily high temperatures, was July 27, when the state averaged 104 degrees. The state’s hottest reading of summer was a sizzling 114 degrees, recorded at Webster Dam in Rooks County not once but twice: first on July 28 and again on August 10. The most 90-degree days at any location were 79, recorded at three different locations near the Oklahoma border: Liberal, Richfield, and Medicine Lodge. Richfield also took top honors at the 100-degree threshold, recording 44 such days. The co-operative observer at Frankfort had the fewest 90-degree days this past summer, with 18. Frankfort was one of at least 10 sites where the temperature failed to reach the century mark.
Precipitation
Precipitation during meteorological summer averaged close to normal. The statewide average for the three-month period of 11.30” was just 0.11” below normal. Total amounts within Kansas’ nine climate divisions ranged from 8.31” in the southwest to 13.89” in northeast Kansas. Departures ranged from -1.09” in the southeast to +1.79” in west central Kansas. Within individual counties, totals ranged from 6.86” in Haskell to 16.78” in Geary County. A total of 46 of Kansas’ 105 counties were above normal, with 59 finishing below normal. Summer departures from normal ranged from -5.69” in Harvey to +3.82” in Logan County.

Figure 2. Average summer 2026 precipitation across Kansas. Map by the Midwestern Regional Climate Center.
June was the wettest of the three months; the average statewide precipitation of 6.44” was 2.39” above normal. It was the 8th wettest June on record for Kansas, and the wettest June since 2014. Southeast (9.84”) was the wettest climate division in the state, and its average ranked as the 6th wettest on record. South central’s total of 8.26” ranked even higher at 5th wettest and was its wettest June since 2008. Within individual counties, seven counties averaged more than 10 inches of rain, led by Neosho County with an impressive 14.20”. This ranked as Neosho’s 2nd wettest June on record, behind only 2007, with a county-wide average of 14.85” of rain. The highest reported total in Neosho County was 17.05” at Erie, but Erie was beaten out for the highest monthly total in the state by a 17.17” total southeast of Belle Plaine in Sumner County. There was one county that recorded its wettest June on record: Kingman County, where the 11.43” average surpassed the old record of 9.70” in 1957.
July and August were drier than normal. July’s average of 2.86” was 0.99” below normal. August was drier still; the state average of 2.00” was 1.51” below normal. The highest county total in July was less than half of Neosho’s June mark: 7.03” in Marshall County. Nearby, the three highest totals in the state were all recorded in Brown County, led by an 11.34” total west of Hiawatha. The same location also had the highest total for the three summer months combined: 24.48”. An interesting coincidence occurred in Greeley County: it was the driest county in the state in June (2.01”) but the wettest in August (4.27”). There were 14 counties that averaged less than one inch in August, compared to 6 in July. June had no counties with less than two inches of rainfall.
Drought Conditions
Despite the state’s precipitation averaging slightly below normal, drought conditions at summer’s end were better than at the beginning. Using the Drought Severity and Coverage Index (DSCI) developed by the National Drought Mitigation Center (NDMC), the highest DSCI came at the start; the index at the beginning of June was 179. June’s abundant rainfall led to improved conditions, and by mid-July the DSCI had fallen to 73. After that minimum was reached, drier conditions led to the DSCI increasing each week over the last six weeks of summer, ending at 139 in late August. In terms of drought coverage (defined by NDMC as a drought category of D1 or worse), the percentage of the state in drought was 56% in early June, down to 27% percent in July, but back up to 46% by August’s end.
Matthew Sittel, Assistant State Climatologist
msittel@ksu.edu