Plant Analysis for Testing Nutrient Levels in Corn
Plant analysis is an excellent in-season “quality control” tool. It can be especially valuable for managing secondary and micronutrients that do not have high-quality, reliable soil tests available and for providing insight into how efficiently you are using applied nutrients.
Kansas farmers can use plant analysis in two basic ways: for diagnostic purposes and for monitoring nutrient levels at a common growth stage. Diagnostics can be done at any time, but are especially valuable early in the season when corrective actions can easily be taken. Monitoring is generally done at the beginning of reproductive growth.
General sampling guidelines:
- Plants less than 12 inches tall: Collect the whole plant; cut the plant off at ground level.
- Plants more than 12 inches tall and until reproductive growth begins: Collect the top fully developed leaves (those which show leaf collars).
- After reproductive growth starts: Collect the ear leaves (below the uppermost developing ear). Samples should be collected at random from the field at silk emergence.
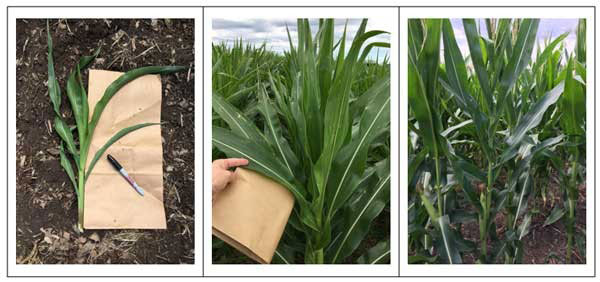
Figure 1. Corn sampling during different growth stages. Photos by Dorivar Ruiz Diaz, K-State Research and Extension.
Plant Analysis for Diagnostic Sampling
When diagnosing field problems, comparing good and poor areas is more important than collecting specific plant parts. Plant tissue analysis is a valuable diagnostic tool for explaining variability in corn growth across a field.
For best results:
- Collect samples from both healthy and affected areas, at any growth stage.
- Take both plant tissue and soil samples from each area to better understand potential causes.
Soil samples may reveal low nutrient levels that explain deficiencies, but physical conditions, such as soil compaction or saturation, can also restrict nutrient uptake, especially potassium, even when soil levels are adequate.
Plant Analysis for Nutrient Monitoring
Plant leaves should be collected as the plant enters reproductive growth for general monitoring or quality control purposes. Sampling under stress conditions for monitoring purposes can give misleading results and is not recommended. Stresses such as drought or saturated soils generally limit nutrient uptake and reduce nutrient content in the plant.
How should you handle collected samples, and where should you send the samples?
The collected leaves should be allowed to wilt overnight to remove excess moisture, placed in a paper bag or mailing envelope, and shipped to a lab for analysis. Do not place the leaves in a plastic bag or other tightly sealed container, as they will begin to rot and decompose during transport, rendering the sample unusable. Most soil testing labs in the region provide plant analysis services, including the K-State Testing Lab. For questions about the plant tissue testing services at the K-State Testing Lab, email soiltesting@ksu.edu or call 785-532-7897.
What nutrients should be included in the plant analysis?
In Kansas, nitrogen (N), phosphorus (P), potassium (K), sulfur (S), zinc (Zn), chloride (Cl), and iron (Fe) are the nutrients most likely to be found deficient. Recently, questions have been raised concerning copper (Cu), manganese (Mn), and molybdenum (Mo), though widespread deficiencies of those micronutrients have not been found in the state.
Normally, the best values are the “bundles” or “packages” of tests offered by many labs. They can be as simple as N, P, and K, or they can be all the mineral elements considered essential to plants. K-State offers a package that includes N, P, K, Ca, Mg, S, Fe, Cu, Zn, and Mn.
What will you get back from the lab?
Laboratories typically report plant tissue analysis results as the concentration of nutrient (or potentially toxic) elements in plant tissue. Results are expressed in:
- Percent (%) for primary and secondary nutrients: nitrogen (N), phosphorus (P), potassium (K), calcium (Ca), magnesium (Mg), sulfur (S), and chlorine (Cl).
- Parts per million (ppm) for most micronutrients: zinc (Zn), copper (Cu), iron (Fe), manganese (Mn), boron (B), molybdenum (Mo), and aluminum (Al).
These nutrient concentrations are usually compared with published sufficiency ranges, reference values derived from surveys of healthy, high-yielding crops. Sufficiency ranges represent the concentrations considered optimal for plant growth. Much like how doctors interpret blood test results using standard reference values, agronomists use these ranges to assess crop nutrition.
Important points to consider:
- Sufficiency ranges vary by plant age, plant part, and even hybrid. Younger plants generally have higher concentrations.
- A value slightly below the sufficiency range doesn't necessarily indicate a deficiency—it may simply reflect dilution from vigorous growth. In fact, very high-yielding crops often test at the lower end of the sufficiency range.
- Significantly low values, on the other hand, may warrant closer investigation into nutrient supply and availability.
Remember that any plant stress conditions (e.g., drought, heat, soil compaction, or saturated soils) can seriously reduce nutrient uptake and plant tissue nutrient concentrations, even if soil nutrient levels are adequate. For example, drought can inhibit nutrient transport to roots, and high soil pH can limit micronutrient availability, especially iron.
Conversely, levels above “sufficiency” can also indicate problems. High concentrations can indicate over-fertilization or luxury uptake. In some cases, plants may accumulate excess amounts of one nutrient to compensate for a deficiency of another—for example, interactions among iron, zinc, and manganese.
Table 1 presents the range of nutrient levels considered normal or “sufficient” for corn seedlings less than 12 inches tall and for the ear leaf at silking. Remember, these are the ranges normally found in healthy, productive crops.
Table 1. The range of nutrient contents considered “normal” or “sufficient” at two growth stages in corn.
|
Nutrient |
Unit |
Whole Plant |
Corn Ear Leaf |
|
Nitrogen (N) |
% |
3.5-5.0 |
2.75-3.50 |
|
Phosphorus (P) |
% |
0.3-0.5 |
0.25-0.45 |
|
Potassium (K) |
% |
2.5-4.0 |
1.75-2.25 |
|
Calcium (Ca) |
% |
0.3-0.7 |
0.25-0.50 |
|
Magnesium (Mg) |
% |
0.15-0.45 |
0.16-0.60 |
|
Sulfur (S) |
% |
0.20-0.50 |
0.15-0.50 |
|
Chloride (Cl) |
% |
Not established |
0.18-0.60 |
|
Copper (Cu) |
ppm |
5-20 |
5-25 |
|
Iron (Fe) |
ppm |
50-250 |
20-200 |
|
Manganese (Mn) |
ppm |
20-150 |
20-150 |
|
Zinc (Zn) |
ppm |
20-60 |
15-70 |
|
Boron (B) |
ppm |
5-25 |
4-25 |
|
Molybdenum (Mo) |
ppm |
0.1-10 |
0.1-3.0 |
|
Aluminum (Al) |
ppm |
<400 |
<200 |
Summary
Plant analysis is a good tool for monitoring the effectiveness of your fertilizer and lime program and a very effective diagnostic tool. Pairing tissue tests with soil samples and accounting for factors such as drought and soil pH can provide a clearer picture of nutrient availability and uptake. Consider adding this agronomic practice to your toolbox.
Dorivar Ruiz Diaz, Nutrient Management Specialist
ruizdiaz@ksu.edu