Beyond Yield Maps: Integrating Yield, Soil, and Topography for Full Field Insight
With the wheat harvest in the rear view mirror for many, we should keep the collected yield data at the front of our minds. Yield maps can tell many interesting stories and help us understand yield, yield variability, and field- and overall-season performance. The yield data alone may not tell the full story and often require additional data, such as topographic, soil type, or remote sensing data, to clearly define field variability.
What Does the Yield Map Tell Us? A Case Study in McPherson County
Wheat yield data were collected using a combine harvester at the Flickner Innovation Farm in McPherson County. A map was created from yield monitor data, showing wheat yield variability across the field. In general, most parts of the field had higher yields (green dots), though there were acres of moderate (yellow dots) and lower yields (red dots) (Figure 1). Although this map indicates areas of low, medium, and high yield in the field, it does not provide a full understanding of the reasons behind the yield pattern. Field variability is often influenced by multiple interacting factors, including soil properties, topography, drainage conditions, and water availability.
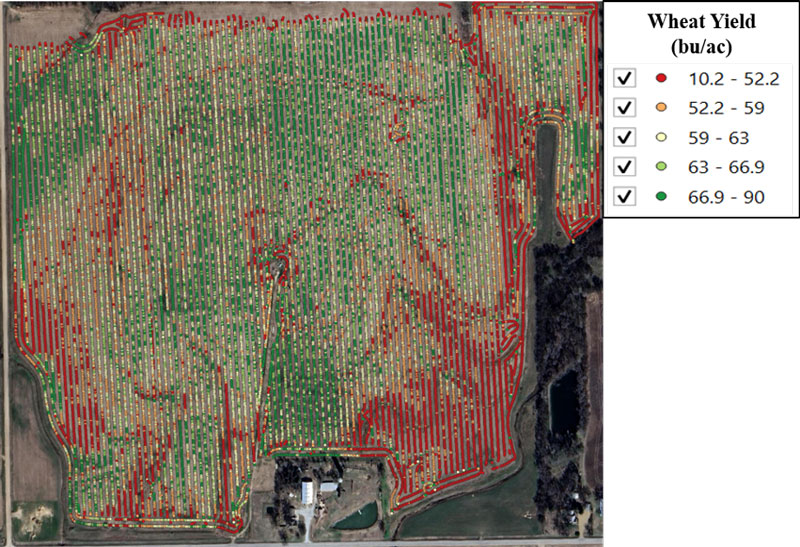
Figure 1. Yield monitor data collected from a wheat field at the Flickner Innovation Farm in McPherson County. Green dots represent high-yield values, yellow dots represent medium-yield values, and red dots represent low-yield values. Photo by Deepak Joshi, K-State Extension
Adding Soil Information
The first type of data that can help explain yield and its patterns in the field is soil properties, such as soil type. Soil property data, such as nutrient content or pH, can be determined through field soil sampling. However, if soil sampling data is not available, other soil data sources include the USDA Web Soil Survey (https://websoilsurvey.nrcs.usda.gov/app/), which is free and available nationwide.
The dominant soil types in the McPherson County wheat field differed in productivity and landscape position, helping explain much of the yield variability observed (Table 1 and Figure 2).
- Crete silt loam (Map Unit 3800): The dominant soil type in the field. It is generally productive and well-drained, with wheat yields typically ranging from 60 to 75 bu/ac.
- Crete silt loam, 1-3% slope (Map Unit 3801): Similar to Map Unit 3800 but with greater slope, which can increase erosion risk. Wheat yields generally ranged from 50 to 60 bu/ac, with some areas producing 70 to 75 bu/ac.
- Smolan silty clay loam (Map Unit 3921): A heavier-textured soil that may limit drainage and increase the risk of waterlogging during wet periods. Yields generally ranged from 50 to 55 bu/ac, with some areas producing only 35 to 45 bu/ac.
- Tobin silt loam (Map Unit 2266): The smallest soil area in the field and the lowest yielding. Located in lower-lying areas that are occasionally flooded, this soil produced wheat yields of 30 to 45 bu/ac.
Table 1. Different Soil Types (map units) with their key features in the wheat field at the Flickner Innovation Farm in McPherson County. This soil-type information is also shown on the map in Figure 2.
|
Map Unit |
Map Unit Name |
Features |
|
3800 |
Crete silt loam, 0 to 1% slopes, loess plains and breaks |
Generally productive, well-drained |
|
3801 |
Crete silt loam, 1 to 3% slopes, loess plains and breaks |
Generally productive, well-drained, but the slope may increase erosion |
|
3921 |
Smolan silty clay loam, 1 to 3% slopes |
Heavier soil, slower drainage |
|
2266 |
Tobin silt loam, occasionally flooded |
Occasionally flooded and may have yield risk |
Adding Topographic Information
While soil type explains part of the observed yield variability, topography provides additional insight into why certain areas yielded higher or lower. Free digital elevation model (DEM) data can be downloaded from the USGS website to add the landscape variation information (https://apps.nationalmap.gov/downloader/). Such landscape maps can help us understand how elevation and slope influence water movement, drainage patterns, erosion potential, nutrient flow, and runoff within a field, and ultimately their impact on yield patterns.
As in Figure 2, we can see how landscape variability looks in the field. Lower landscape positions, especially map unit 2266, often receive runoff from surrounding areas and may remain wetter for longer periods after rainfall events. These conditions can increase the risk of waterlogging, reduce root growth, and ultimately lower crop yields. In contrast, higher landscape positions generally have better drainage but may be more susceptible to moisture stress during dry years (Figure 2).
When topographic information is combined with soil and yield data, producers can identify areas where poor drainage, water accumulation, or erosion may be contributing to yield limitations. These insights can help guide management decisions such as drainage improvements, variable-rate input applications, and targeted conservation practices.
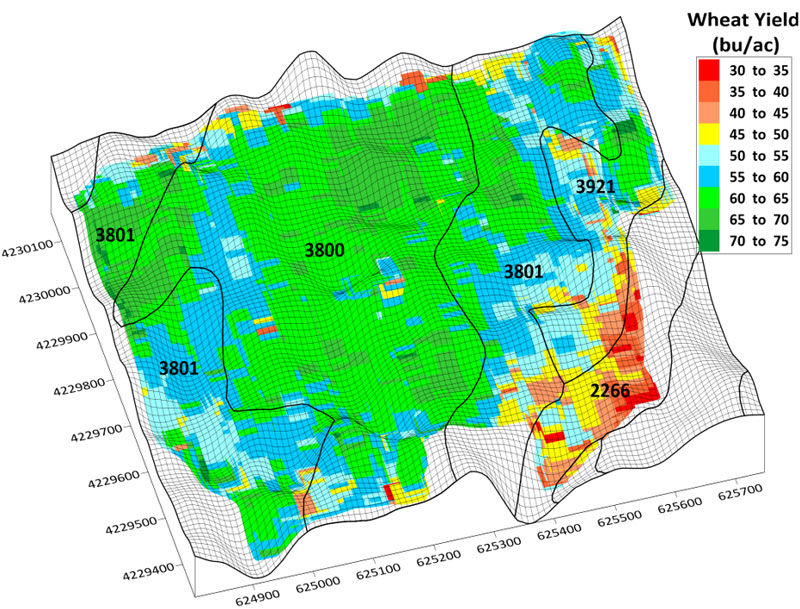
Figure 2. Wheat yield map at the Flickner Innovation Farm in McPherson County, combined with soil type (map units) and landscape data, for more detailed insight into field variability. Numbers inside polygons on the map represent each map unit, which are discussed in more detail in Table 1. Photo by Deepak Joshi, K-State Extension.
Take Home Message
In precision agriculture, yield monitor data alone may not tell the complete story of field performance. Yield maps generated from yield monitor data show where variability occurs. However, soil maps can help explain what may be causing it, and topographic and landscape information provides insight into how water and nutrients move across the landscape. Together, these datasets offer a more complete understanding of field variability and support more informed management decisions. Besides yield, soil type, and topographic data, some other data, such as sensor-based soil properties, remote sensing-based drone and satellite imagery, and other data, can also be added to provide a more detailed understanding of field variability in precision agriculture.
Deepak Joshi, Precision Ag Extension Specialist
drjoshi@ksu.edu
Logan Simon, Southwest Area Agronomist
lsimon@ksu.edu
Tina Sullivan, Northeast Area Agronomist
tsullivan@ksu.edu
Romulo Lollato, Wheat & Forage Specialist
lollato@ksu.edu