Kansas Soil Moisture Update – October 21, 2026
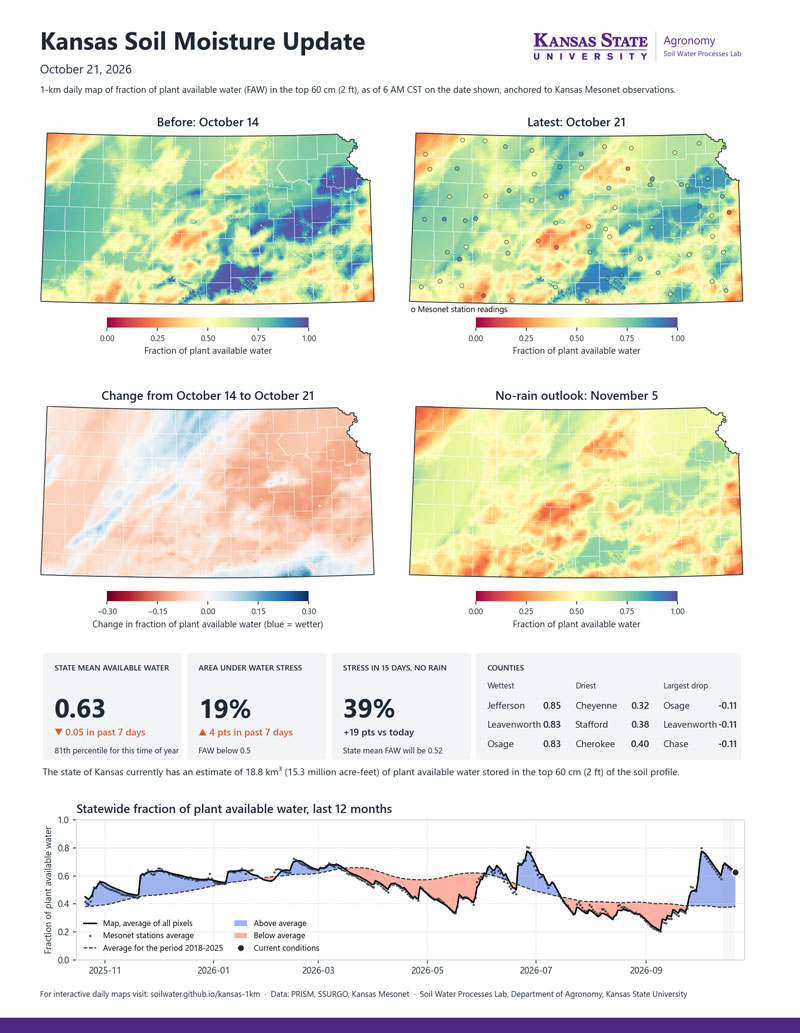
Soil moisture changed little across Kansas during October 14–21, with a modest statewide drawdown most noticeable in central and south-central Kansas. The statewide average fraction of plant available water (FAW) in the top 2 feet (60 cm) of the soil profile eased from 0.68 to 0.63, and the area below the water-stress threshold rose to 19%. Jefferson, Leavenworth, and Osage counties are the wettest (FAW of 0.83–0.85), while Cheyenne, Stafford, and Cherokee counties reported the lowest county averages (FAW of 0.32–0.40). With evaporative demand easing, soil moisture will change more gradually from here unless there is a rainfall event.
Understanding Plant Available Water and FAW
Plant available water is the portion of soil moisture that plants can use. It is the water held between the wilting point and field capacity. The maps show the fraction of available water (FAW) in the top 2 feet (60 cm) of the soil profile on a scale from 0 to 1. A value of 0 means that any existing water is tightly held in the soil and generally not available to plants. A value of 1 means the soil holds its full supply of plant available water after excess water has drained away. A value of 0.5 means about half the plant available water remains, a level at which many crops may begin to experience water stress. Because each mapped location is scaled to its own wilting point and field capacity, the same color represents the same fraction of available water statewide, allowing comparisons across different soil textures.
Link to soil moisture maps: https://soilwater.github.io/kansas-1km/
Andres Patrignani, Associate Professor in Soil Water Processes
andrespatrignani@ksu.edu