Kansas Mesonet Fall Freeze Monitor and Winter Cold Tool Available
The first freeze of the fall for Kansas was behind schedule this year, but finally occurred this past Friday, October 16-17 (Figure 1). Prior to the freeze, cool highs were in the 50s statewide on Friday afternoon. With dry air in place, combined with clearing skies and lighter winds, temperatures cooled rapidly on Friday evening. Over 20 Kansas Mesonet sites had already fallen to below freezing by midnight Saturday. By Saturday morning, a total of 65 (of 95) Mesonet sites recorded lows of 32° or colder. The Hamilton County site near Syracuse was the state’s cold spot, with a low of 23 degrees. The temperature at Hamilton was below 28° (considered a hard freeze) for nearly 7 consecutive hours, exceeding the 4-hour threshold for a hard freeze. Two additional Mesonet sites registered a hard freeze: Kinsley 6E (Edwards County) and Meade (County). Southeast Kansas was largely spared from freezing conditions, as temperatures only cooled to the mid and upper 30s with many observing their first frost of the fall.
The Kansas Mesonet’s Freeze Monitor (https://mesonet.k-state.edu/airtemp/min/hoursbelow/) is a great tool to examine the magnitude/duration of cold conditions. This tool allows users to track real-time conditions and compare current freeze events to long-term climatology.
- How does this year’s first freeze compare to average?
- For how long was it below freezing (or other temperature thresholds)?
- Should we be concerned about crop damage?
The Freeze Monitor provides quick answers to these questions and more.
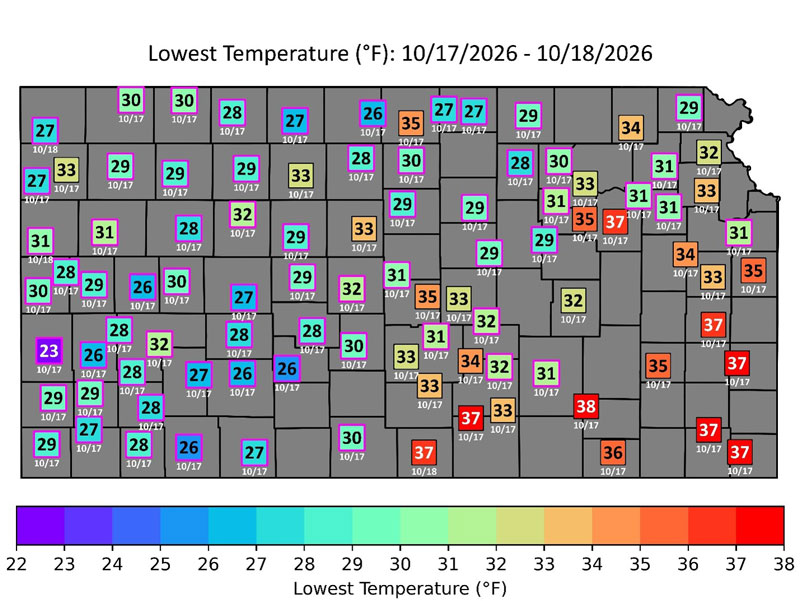
Figure 1. The coldest temperature (in °F) recorded across the Kansas Mesonet this past weekend. Stations that fell below freezing are indicated with magenta outlines around their squares. The date of the coldest reading appears underneath each station’s square.
The average freeze date (32°F) in northwest Kansas can occur as early as the last week of September (Figure 2). However, southeast Kansas does not usually see freezing temperatures until the end of October. You can find the average first freeze dates by location here: https://mesonet.k-state.edu/airtemp/min/hoursbelow/#tab=table-tab&mtIndex=6. The “Table” tab lists the average dates on the right side (Figure 2).
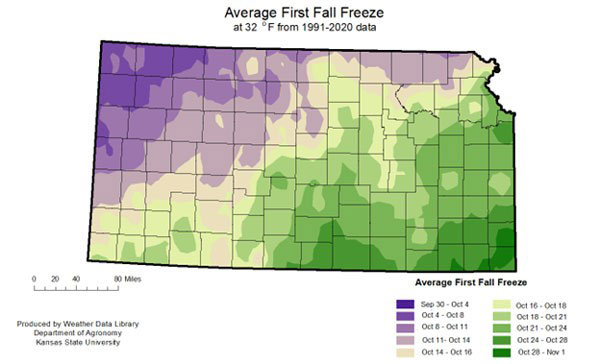
Figure 2. Average fall freeze dates for Kansas. Source: Kansas Weather Data Library.
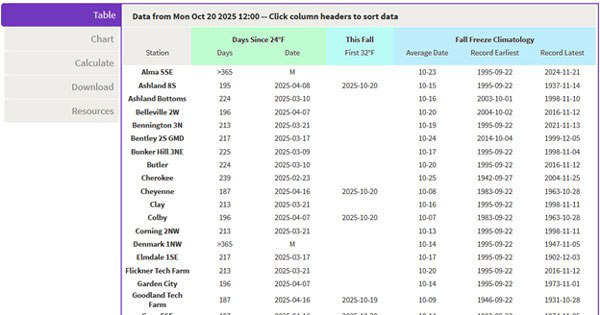
Figure 3. First freeze date averages for all Mesonet stations as found on the “Table” tab. Source: Kansas Mesonet.
Historically, almost all parts of the state have recorded freezing temperatures as early as September. The earliest first freeze on record in Kansas was September 3, 1974, when many stations dropped below freezing. However, this year, the first freezes have fallen as much as two weeks later than normal in the northwest and a week later than normal in north-central Kansas.
Common question: “How cold did it get?”
The Freeze Monitor tool displays the coldest temperatures observed across Kansas during the previous two weeks (the most recent freeze event is shown; Figure 4). It also tracks the first fall freeze date for each station, for comparison with local climatology, in a table (https://mesonet.k-state.edu/airtemp/min/hoursbelow/#tab=table-tab&mtIndex=6), as shown in Figure 3. Data updates every twenty minutes on both the map and the table.
Common question: “Was it cold long enough to damage crops?”
It is important for producers/gardeners to estimate the duration below freezing, providing insight into the potential for damage to crops/commodities that may have lower thresholds for damage. This feature allows users to select options to view maps/data of the “hours below 32°F”, “hours below 24°F,” and the “hours below 12°F”). While all three are of interest, the lower two thresholds are especially important to wheat growers later in the fall/winter season.
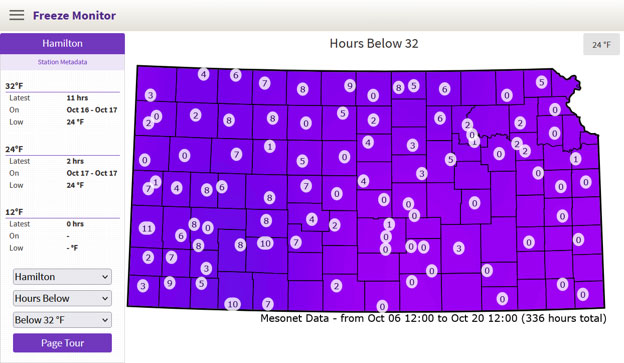
Figure 4. View of the Freeze Monitor webpage on October 20, 2026. Hamilton (selected station) shows the freeze event on October 17, 2026. The map represents the latest freeze events at these locations since October 7, 2026. Source: https://mesonet.k-state.edu/airtemp/min/hoursbelow/#tab=table-tab&mtIndex=0
Common question: “How long has it been above freezing?”
The freeze monitor can also track the duration of days since the last freeze or below the 24°F and 12°F thresholds. This is ideal for determining the first freeze and estimating the length of the growing season. You can find “days since” using this link: https://mesonet.k-state.edu/airtemp/min/hoursbelow/#tab=table-tab&mtIndex=6. The last freeze in the spring occurred in early April, and with the later-than-normal freeze for most of Kansas thus far, this has resulted in a longer-than-normal growing season. Many locations had gone 180+ days without freezing temperatures before the freeze on the 17th. In south-central and southeast areas, the last freeze was earlier, and most locations have over 200 days. This data can be observed in the “Days Since 32” option (Figure 5).
The freeze on October 17th resulted from a very shallow cold air mass. As a result, Mesonet weather stations at higher elevations than the surrounding terrain remained in a warmer air mass just above the ground. This was especially noted at Russell Springs, Plainville, and Jewell. Whereas the comparatively lower-elevation stations nearby dropped below 32°F. Further east, cooler air sank into the valleys with most stations residing on hilltops. As a result, these valley stations recorded a freeze, like Butler, Olathe, Flickner Tech, and Hutchinson 1NW, being outliers to the surrounding stations (Figure 5).
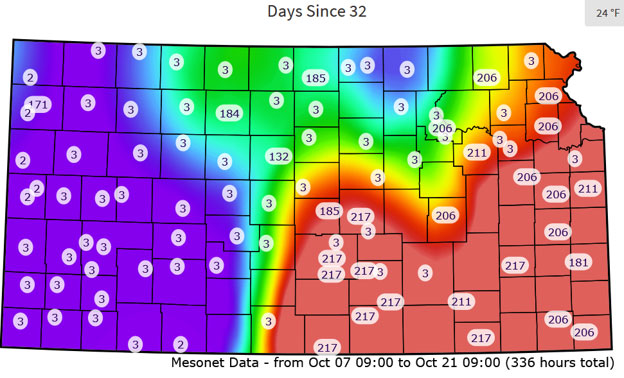
Figure 5. Number of days since the last freeze as of October 21, 2026. Find this information here: https://mesonet.k-state.edu/airtemp/min/hoursbelow/#tab=table-tab&mtIndex=6.
The data displayed in the tables below the maps can be sorted. Clicking on the header of a particular column will sort the table by that column. This makes it much easier to see which area was the coldest in the state, as well as the earliest freeze and earliest climatological freeze data. There are several download options, including table and chart data, as well as images of the maps.
The Freeze Monitor remains operational throughout the winter and is available for the 24°F and 12°F thresholds, in addition to the 32°F threshold, for those arctic air masses and focuses on potential concerning levels for wheat. As we approach spring, the Freeze Monitor will be updated to display the spring freeze climatology.
Chip Redmond, Weather Data Library/Mesonet
christopherredmond@ksu.edu
Matthew Sittel, Assistant State Climatologist
msittel@ksu.edu
Dan Regier, Weather Data Library/Mesonet
regierdp@ksu.edu