Kansas Soil Moisture Update – 2026 Water Year Summary
A water year runs from October 1 to September 30 and is named for the year it ends in. It starts in the fall, when soils begin to recharge after the growing season, so it follows one full cycle of soil wetting and drying. FAW goes from 0 (soil water not available to plants) to 1 when the soil profile is at field capacity.
Figure 1 maps the median fraction of plant available water (FAW) in the top 2 feet (60 cm) of the soil profile for each of the last eight water years, at 1-km resolution.
In water year 2026 (October 2025 to September 2026), the median statewide FAW was 0.55. That is a little below 2025 (0.60) and well above the drought years of 2022 (0.35) and 2023 (0.31). Moisture followed the usual pattern, rising from west to east. Western Kansas had a median of about 0.42, compared with 0.68 in the eastern third of the state. The driest areas were in southwest and far-western Kansas and in a pocket of north-central Kansas along the Nebraska border, where FAW often stayed between 0.2 and 0.35. The wettest soils were in south-central Kansas around Wichita and in the northeast corner, where FAW was often above 0.75. Overall, 61% of the state had a median FAW of 0.5 or higher. That is down from 85% in 2025 but far above 2023, when only 21% of the state reached 0.5.
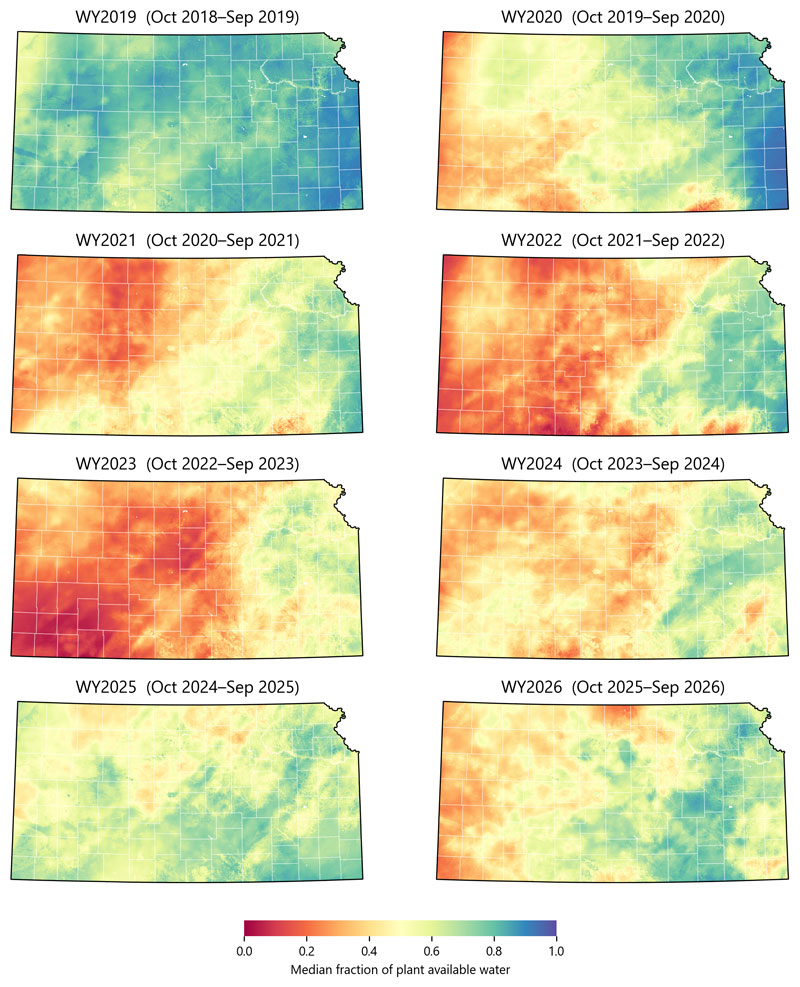
Figure 1. Median fraction of plant available water (FAW) in the top 2 feet (60 cm) of the soil profile across Kansas at 1-km resolution for water years 2019–2026. Red shows drier soils and blue shows wetter soils. Maps prepared by Andres Patrignani, Kansas State University.
Understanding Plant Available Water and FAW
Plant available water is the portion of soil moisture that plants can use. It is the water held between the wilting point and field capacity. The maps show the fraction of available water (FAW) in the top 2 feet (60 cm) of the soil profile on a scale from 0 to 1. A value of 0 means that any existing water is tightly held in the soil and generally not available to plants. A value of 1 means the soil holds its full supply of plant available water after excess water has drained away. A value of 0.5 means about half the plant available water remains, a level at which many crops may begin to experience water stress. Because each mapped location is scaled to its own wilting point and field capacity, the same color represents the same fraction of available water statewide, allowing comparisons across different soil textures.
Link to soil moisture maps: https://soilwater.github.io/kansas-1km/
Andres Patrignani, Associate Professor in Soil Water Processes
andrespatrignani@ksu.edu